
Asia Pacific Airlines August 2026 Traffic Results
Asia Pacific Airlines August 2026 Traffic Results
Passenger traffic remains soft, while cargo demand rises further
Kuala Lumpur, Malaysia - Preliminary August 2026 traffic figures released today by the Association of Asia Pacific Airlines (AAPA) showed that international passenger traffic remained soft, as some airlines further rationalised capacity amid persistently elevated jet fuel prices, and airspace restrictions associated with the Middle East conflict. Higher air fares also weighed on regional demand, while long-haul traffic remained relatively resilient, including on Asia – Europe routes.
Overall, Asia Pacific airlines carried 33.5 million international passengers in August, 0.6% fewer than a year earlier. Passenger demand, measured in revenue passenger kilometres (RPK) rose by 1.8% year-on-year. Capacity, measured in available seat kilometres, increased by 1.5%, lifting the average international passenger load factor by 0.2 percentage points to 83.2%.
Meanwhile, air cargo markets continued to benefit from rising export activity and brisk demand for AI-related goods, although e-commerce shipments to Europe showed some weakness following the introduction of charges on small parcels. International air cargo demand, as measured in freight tonne kilometres (FTK), grew by 1.1% year-on-year, while offered freight capacity expanded by 1.6%. As a result, the average international freight load factor fell by 0.3 percentage points to 59.3% for the month.
Commenting on the results, Mr. Wong Hong, Director General of AAPA, said, “"Traffic growth has moderated in recent months, but the picture remains broadly positive. Asia Pacific airlines carried 259.3 million international passengers in the first eight months of theyear, 2.1% more than in the same period last year. International air cargo demand rose by a strong 5.5% over the same period.”
Mr. Wong Hong added, “Despite the year-to-date growth in traffic, the operating environment remains challenging. Elevated jet fuel prices, airspace restrictions and weaker Asian currencies are raising costs, while higher fares weigh on price-sensitive travellers. These factors continue to affect profitability, with outcomes varying across individual airlines.”
Looking ahead, Mr. Wong Hong said, “Regional economic growth and trade activity should continue to support demand for air travel and cargo, although growth is likely to remain uneven across markets. Geopolitical developments and changes in trade policies add some uncertainty to the outlook for the remainder of the year.”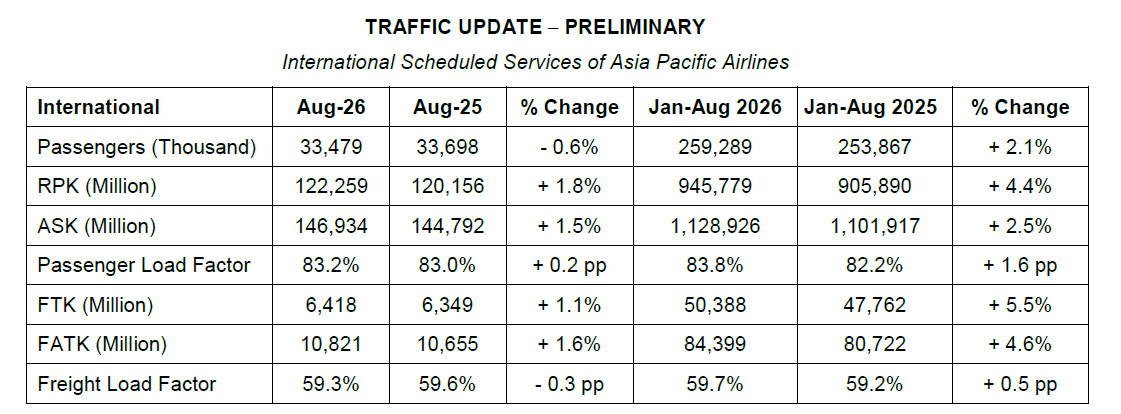
Effective September 2025, the dataset comprises aggregated traffic data from the following 36 Asia Pacific based carriers: 5J, 6E, 7C, 9C, AI, AK, BI, BR, CA, CI, CK, CX, CZ, D7, GA, HO, HU, IX, JL, JQ, KC, KE, KZ, MH, MU, NH, NZ, PG, PR, QF, SG, SQ, TG, TR, VA and VN.
• Previous year data adjusted for comparison purposes
• RPK = revenue passenger kilometres
• ASK = available seat kilometres
• FTK = freight tonne kilometres
• FATK = available freight tonne kilometres
• All figures, including estimates for missing data, are provisional
Association of Asia Pacific Airlines (AAPA)
The AAPA is the trade association for scheduled international airlines based in the Asia Pacific region. The AAPA permanent secretariat is headquartered in Kuala Lumpur, Malaysia with international representation in Brussels and Washington, D.C. Collectively, the region’s airlines represent over one-third of global passenger and air cargo traffic, and thus play a leading role in the ongoing development of global aviation.
